



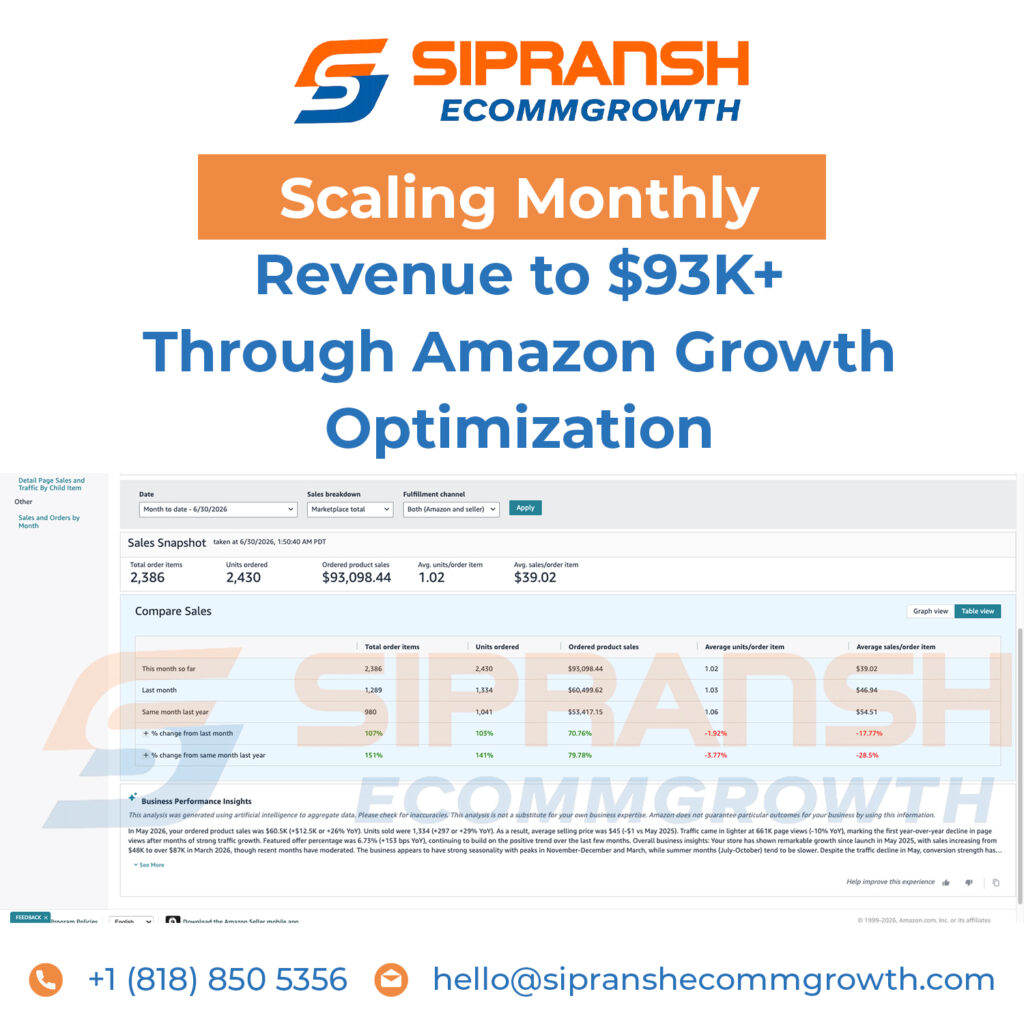
Operating in a competitive Amazon marketplace, the business had established a consistent sales foundation but needed to accelerate growth and capitalize on increasing customer demand.The primary objective was to increase revenue and order volume while maintaining sustainable account performance, rather than relying solely on higher traffic or discounts.
By analyzing sales trends, customer behavior, product performance, and marketplace demand, the strategy focused on identifying opportunities for scalable growth.
The business entered June with sales of $60,499.62 in the previous month. The goal was to build on this existing momentum and significantly increase monthly revenue.
Although revenue was growing, increasing the number of orders and units sold was essential for creating a stronger and more sustainable sales base.
Average sales per order item declined from $46.94 to $39.02, indicating that revenue growth was being driven primarily by a significant increase in order volume rather than higher-value purchases.
This created an opportunity to focus on volume growth, product mix, and upselling opportunities.
The business had already demonstrated strong growth compared with the previous year, creating the challenge of maintaining momentum while scaling to a larger revenue base.
Sales performance was analyzed across three key periods:
This provided visibility into both month-over-month momentum and year-over-year growth
The analysis helped identify the scale of growth and highlighted the key metrics contributing to the increase.
The strategy prioritized increasing the number of customers and units sold rather than relying solely on increasing average order value.
June performance reached:
Compared with May:
This represented a substantial increase in purchasing activity.
Performance data was used to identify:
Rather than evaluating performance based on revenue alone, the analysis considered orders, units, average sales per order, and year-over-year trends.
The business showed strong momentum following its launch and continued to expand its revenue base.
The strategy focused on leveraging this momentum by maintaining visibility and supporting products that demonstrated stronger customer demand.This helped convert increased marketplace traffic and demand into a higher volume of completed purchases.
The optimization strategy delivered significant growth in June 2026.
Metric |
June 2026 |
Change vs. May |
Change vs. June 2025 |
Total Order Items |
2,386 |
+107% |
+151% |
Units Ordered |
2,430 |
+103% |
+141% |
Ordered Product Sales |
$93,098.44 |
+70.76% |
+79.78% |
Avg. Units/Order Item |
1.02 |
-1.92% |
-3.77% |
Avg. Sales/Order Item |
$39.02 |
-17.77% |
-28.5% |
The business generated $93,098.44 in ordered product sales, crossing the $90K monthly revenue milestone.
Sales increased from $60,499.62 in May to $93,098.44 in June, representing a 70.76% increase.
Compared with $53,417.15 in June 2025, June 2026 sales increased by 79.78%.
Total order items increased from 1,289 to 2,386, more than doubling month over month.
Units ordered increased from 1,334 to 2,430, demonstrating substantial growth in purchasing volume.
One of the most important findings was that revenue growth was primarily volume-driven.
While average sales per order item declined from $46.94 to $39.02, total revenue increased by more than 70%.
This indicates that the business successfully expanded its customer and order base, creating a stronger foundation for future growth.
The next opportunity is therefore to combine this increased volume with strategies designed to improve average order value and product mix.
With the business already generating more than $93K in monthly sales, the next phase should focus on converting the current growth momentum into sustainable expansion.
Key opportunities include:
This case study demonstrates how data-driven Amazon optimization can transform existing momentum into significant revenue growth. By focusing on sales trends, order volume, unit growth, and customer demand, the business increased monthly sales from $60,499.62 to $93,098.44, achieving 70.76% month-over-month growth and 79.78% year-over-year growth. Orders more than doubled, while units increased by 103%. The key takeaway is that sustainable Amazon growth comes from understanding what drives revenue—not simply chasing higher sales. With continued optimization of product performance, visibility, conversion, and average order value, the business has a strong foundation for further scalable growth.