As a seller on Amazon, you must have seen the endless number of reports available in Seller Central. These plenty of reports provide data on your inventory, orders, returns, advertising, and tax documents, and confuse the sellers to identify which ones to track regularly. Most sellers don’t know which reports they should be monitoring, aren’t even sure if they are correctly reading the reports, or can’t figure out how to leverage the information to make a real difference in their accounts. So let’s cut through the noise of those numerous metrics and get a brief actionable understanding of your business using the reports in Amazon Seller Central. In this blog, you’ll learn which reports to generate, how to read the data of those reports, and which metrics to track in this blog.
What are Amazon Seller Reports?

Amazon seller reports provide valuable insights and data to sellers so they can track the performance of their business. In these reports, sellers get data, such as the number of units you’ve ordered, how many people visit your listings, conversion rates, sales totals, and your Buy Box percentage.
Besides the above, there are also reports available in Seller Central, such as return reports, advertising reports, FBA fulfillment reports, and stranded inventory reports. These reports enable the seller to see the performance of every aspect of their business so they can make decisions about how to move forward. Instead of making decisions based only on instincts, sellers can use this valuable data that Amazon offers and grow their business.
Why is Seller Central Report Important?
Amazon Seller Central presents data and reports unavailable at other eCommerce platforms. These valuable insights help sellers know their overall account health, the best-performing and poor-performing products, advertising campaigns performance, and more. There could be growth opportunities or warning signals right under your nose that might be unknown to you. Hence, these seller reports analysis is an obvious step in your business performance analysis and optimization. Sellers who couldn’t understand or decipher these reports miss out on countless performance optimization opportunities and remain ignorant of the ongoing issues and account concerns.
There is a surplus of opportunities within your Amazon business reports in Amazon Seller Central. Learn what kind of progress you’re making, and don’t miss out on potential sales and profit with these reports. With the valuable information provided in Amazon reports, you’ll be able to improve your conversion rates and sales volume, reduce ad spending, etc.
The great thing about each report is that you can download it as a CSV file and open it with Microsoft Excel or Google Sheets.
Top Amazon Seller Central Reports to Grow Your Business
With so many reports available on Amazon, sellers often find themselves at odds with which reports to study. It’s always a good idea to get an understanding of all the reports Amazon is providing as every report can give some new information to make your Amazon account and products better but sellers should focus on reports that directly impact your account, sales, and advertising performance. Below are the 10 most important reports explained:
Where Can You Excess Your Business Reports?
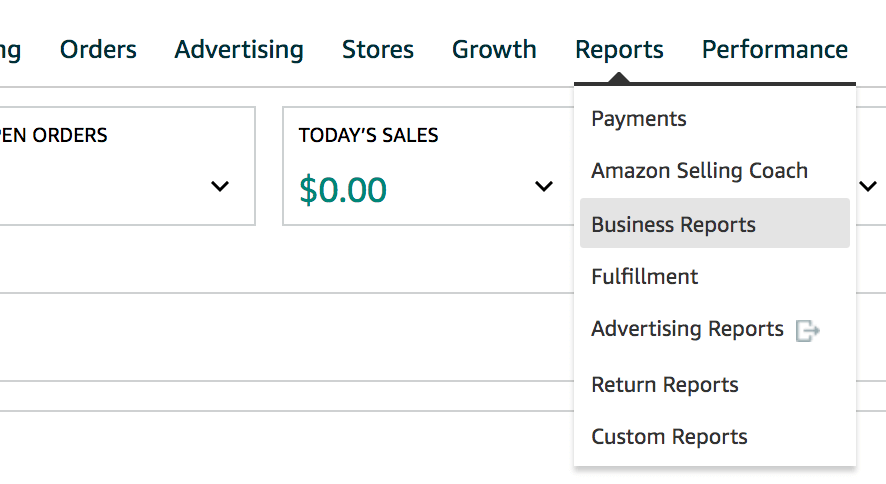
To access, go to the Reports Tab in Seller Central and click on the Business Reports.
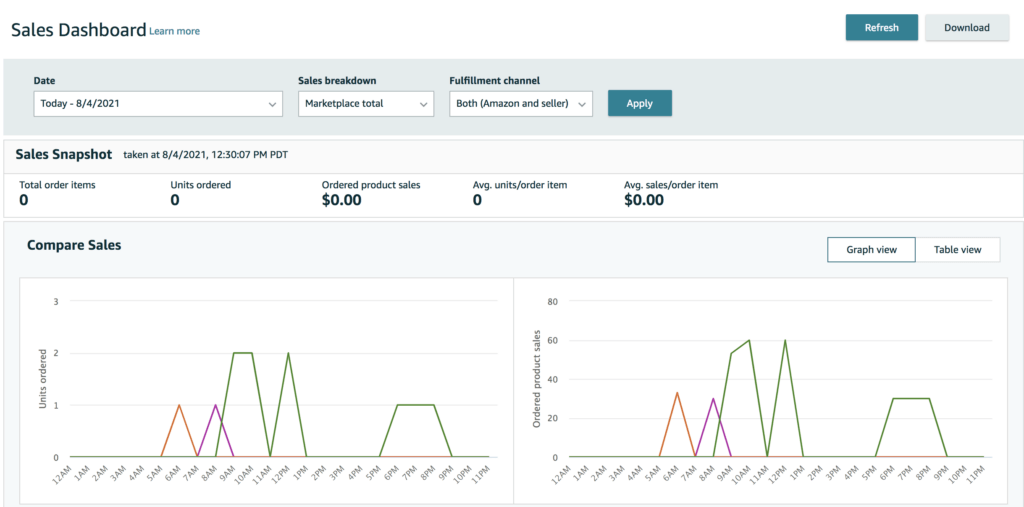
When your Sales Dashboard page opens (which is also known as Amazon seller central sales report – you can see a quick overview of your total sales on Amazon. You can select to view today’s sales, week-to-date, month-to-date, year-to-date, or a custom date range.
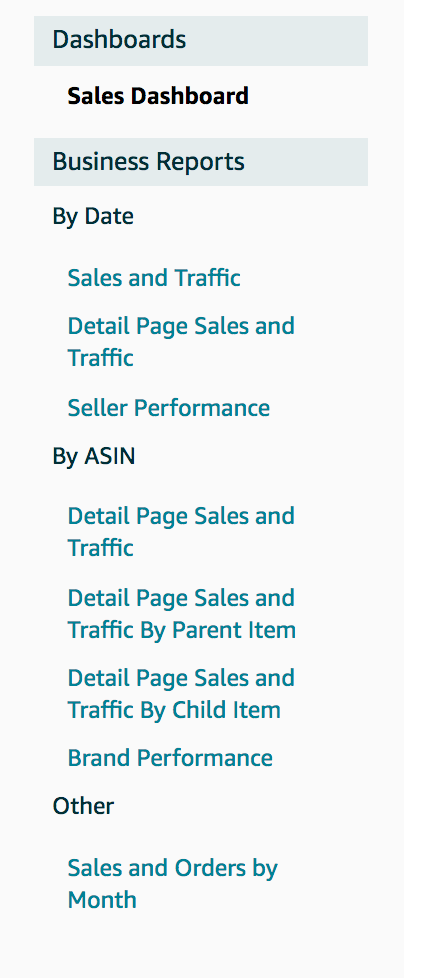
On the left-hand side of the dashboard, there are various other reports to review.
1. Detail Page Sales & Traffic By Child Item

Analyzing the Detail Page Sales and Traffic By Child Item report can help you concentrate on the performance of each product. This report breaks down crucial metrics such as sales, total items ordered, sessions, and page views for each of your products, including child variations. This report is helpful because it tells you how many views each one of your products receives, as well as their conversion rate. This data helps you decide how you should price, market, and sell your products.
Below are the types of information you can see in this report:
- Sessions: The total number of visitors to your product page within 24 hours shown in sessions. Because of this, you can see how many customers viewed your listings within your desired time range. If the number of views is low, you can work on it and increase traffic to your product page.
- Page Views: The total number of views on your listings within your selected period. This number contains customers who viewed your listing more than once, so it may be higher than your sessions.
- Page Views Percentage: The percentage of page views a specific ASIN you own receives compared to your other products.
- Buy Box Percentage: It shows the percentage of page views where you owned the Buy Box. This metric is helpful if you’re an arbitrage and wholesale reseller because you can see how often you get the Buy Box compared to competitors selling on a similar listing. Also useful if you’re a private label seller and have less than 100% of the Buy Box.
- Units Ordered: The total number of units ordered during the specified date range shows here. It is helpful to track each month so you can see if there are any dips or growth in product sales.
- Unit Session Percentage: This is also known as conversion rate. The most useful metric in the report is this. Your conversion rate is the percentage of how many units were bought compared to the number of people who viewed your listing.
- Ordered Product Sales: It is the total revenue for each one of your products during a specified date range. Another helpful metric to track so you can ensure your product sales are increasing each month.
- Total Order Items: This tells you the total number of orders placed for a specific item. This number can be equal to or less than the total number of units ordered because a customer may place a single order for multiple items.
The three most fundamental metrics in business reports are: Buy Box Percentage, Sessions, and Unit Session Percentage (conversion rate). The average conversion rate on Amazon is around 7-10%. Although the conversion rate depends on product niche, copy, reviews, and many other factors, sellers should strive to keep their conversion ratio above 10%. A low conversion rate means that you need to work into your listing. Common reasons for a low conversion rate includes:
- Poor reviews.
- High price.
- Low-quality images.
- Fails to answer common customer questions.
- Lack of Enhance Brand content/A+ Content.
Sessions tell you the number of consumers that visit your detail page. You may have reliable conversion rates, but if your traffic is low, you won’t be able to get your revenue targets. Your goal should be to boost your total sessions and bring qualified traffic to your listing. Do not target irrelevant or too broad keywords, or your conversion rate will drop. Some of the modes to obtain purchase-ready traffic to your listing would be:
- Start running Sponsored Ad campaigns with an Amazon marketing agency
- Adding high-volume (and relevant) keywords to your listing
- Involving off-Amazon advertising in your marketing strategy
Buy Box percentage should always be 100%; if it’s not, you need to figure out why. A low Buy Box percentage is a common reason for the low conversion rate. Here’s how you can get hold of the Buy Box.
Hire an Amazon optimization agency and identify the exact reason for the low conversion ratio.
1. Return Reports
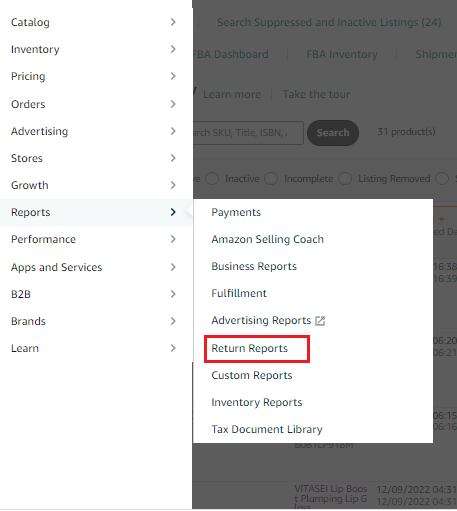
Return report shows a list of the total returns you have received within a certain period. Sellers can identify the ASINs that customers return the most. Also, figure out why customers returned these orders and how to reduce the number of returns. You can access your return reports in “Reports”> “Return Reports.”
2. Subscribe & Save Performance Report + Subscribe & Save Forecasting Report
Sellers who registered in the FBA Subscribe & Save program can use these reports to better plan their inventory and pricing and maintain compliance with the terms and conditions of the program.
The Subscribe & Save Performance report shows summed data of a four-week view of items shipped, the percentage of orders missed due to being out of stock, the average post-discount sale price, and the average discount for each SKU.
The Subscribe & Save Forecasting report delivers an 8-week forecast of sales based on existing subscriptions and sales history.
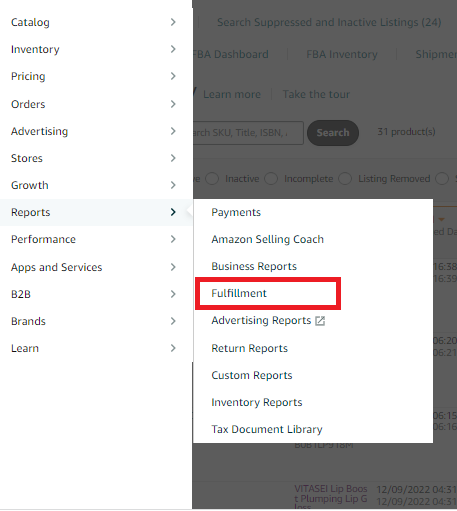
You can access this report by going to “Reports”> “Fulfillment.” You’ll see the Subscribe and Save Forecasting report under the “Inventory” section and Subscribe and Save Performance report under the “Sales” section.
3. Stranded Inventory Report
The inventory that does not have an active listing in your FBA centers is Stranded Inventory. Sellers with a vast catalog can use the Stranded Inventory report to identify stranded listings. Amazon shows the reason for stranded listing in the Stranded reason column on Fix Stranded inventory.
You can access the stranded inventory report by going to “Reports”> “Fulfillment.” You’ll find the Stranded Inventory report under the “Inventory” section.

4. Manage Inventory Health Report
Data from the Manage Inventory Health report provides the necessary information for efficient inventory management for sellers. This report shows a consolidated view of your inventory metrics across sales, shipment statuses, fees, and aged and excess units to help you recognize and take action on your overstocked inventory.
The following metrics mentioned below help you make inventory management decisions:
- Approx calculated monthly and long-term storage fees on your next charge date
- Seven-day, 30-day, 60-day, and 90-day sales, and the shipped units
- Days of Supply
- Excess units
- Your list prices
- Recommended actions for aged and excess inventory
- Shipment quantities: working, shipped, and receiving
You can access this report by going to “Reports”> “Fulfillment.” The Manage Inventory Health report is under the “Inventory” section as “Inventory Health”
5. Amazon Search Terms Report (Brand Analytics)
The Amazon Search Terms reports are available within the Brand Analytics dashboard. It is often confused with an advertising report called the Amazon Search Term report.
The Brand Analytics Search Terms report shows the most popular search terms in the Amazon store during a given period, the percentage of conversions for a particular search term, verified keyword volume, and more. The report shows each product’s click share and conversion share for the top three products.
You can access this report by going to “Brands”> “Fulfillment.” You’ll find the Amazon Search Terms report on the left side of the dashboard.
6. Search Term Report (Advertising)
Amazon Search Term report is the most popular report as it reveals the terms shoppers use to find and purchase your product. It helps you build a keyword list and discloses negative keywords that waste your money. You can gather search terms from this report and utilize them in your listing copy and advertising campaigns.
Filter the data by ACOS to optimize your PPC campaigns using search term reports. Increase bids on profitable keywords or keywords having low impressions and remove the keywords that aren’t performing well. The search terms with many clicks, no sales, or high ACOS will go directly to your negative keyword list. ASINs in your search term list indicate that your ad was on your competitor detail page. Add the ASIN to your negative keyword list if you don’t want that to happen again.
7. Placement Report
Placement reports help you study whether your ad converts better when at the top of search results, in the rest of the search, or when shown in a carousel on competitor ASINs’ detail pages. This data is retrieved directly from the campaigns dashboard, which shows you all the reports in one place.
Assume your product converts well on competitors’ detail pages. Advertise these ASINs using Sponsored Display campaign on detail pages which has a higher price and lower reviews than your product.
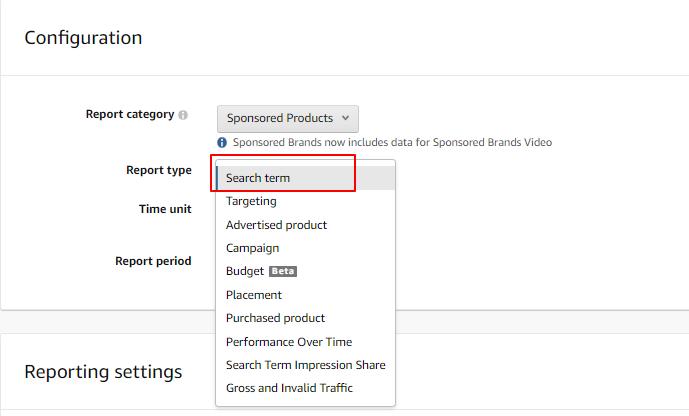
You can access this report by going to “Reports”> “Advertising Reports.” Hit the “Create Report” button. Choose the “Placement” report from the dropdown menu for Sponsored Product/ Sponsored Brand campaigns.
8. Targeting Report
The targeting report lists every keyword, ASIN, and category you are bidding on with the match type. It helps by identifying the exact keywords and stops your ads from competing against each other.
You can access this report by going to “Reports”> “Advertising Reports.” Click the “Create Report” button and choose the “Targeting” report from the dropdown menu for Sponsored Product campaigns.
9. Advertised Product Report & Purchased Product Report
Advertised Product report helps you identify the product advertised Vs the product purchased. The report that shows the non-advertised ASINs shopper purchased after clicking on your ad is the purchased Product Report. The report shows the details of the product bought and the keyword attributed to the purchase. Use the Purchased Product report and create successful Amazon bundles.
You can access these reports by going to “Reports”> “Advertising Reports.” Click the “Create Report” button. From the dropdown menu, select “Advertised Product Report” or “Purchased Product” report for Sponsored Product campaigns.
10. Item Comparison Report
You’ll find every type of Fulfillment report available on your left-hand side. The Item Comparison Report is another Brand Analytics report. You can use the Item Comparison to find competing products and research you can improve your product.
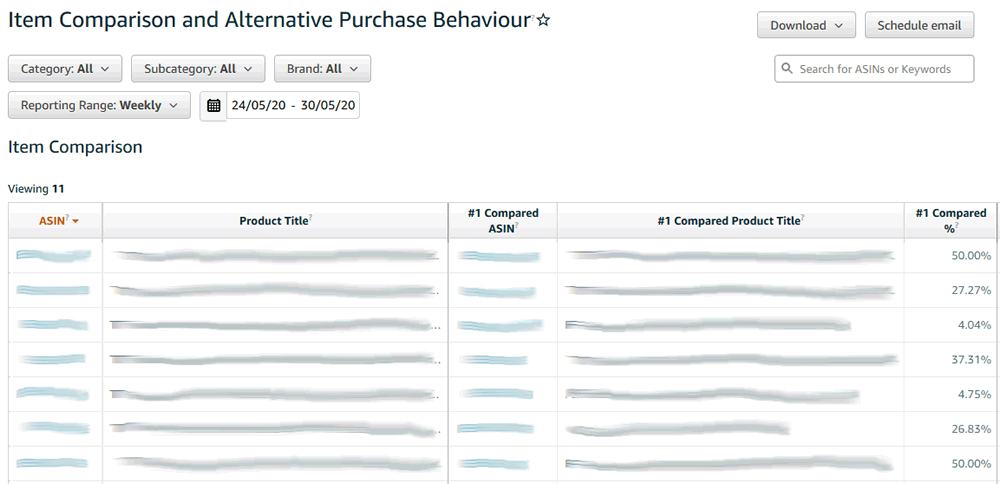
The report shows customers who viewed your product and then viewed your competitor’s product and went on to purchase it within the same day.
It gives a good insight into how many customers look at your competitors’ products.
11. Fulfillment Reports
This report helps you learn about your FBA inventory as a whole. There are many reports here, such as Long-Term Storage Fee reports, Subscribe & Save Performance, Promotions Performance, Stranded Inventory, Returns, and Inventory Age & Health.
Learn about these reports and fully understand how your Amazon FBA business is running.
To access it, go to “Reports” > “Fulfillment.”
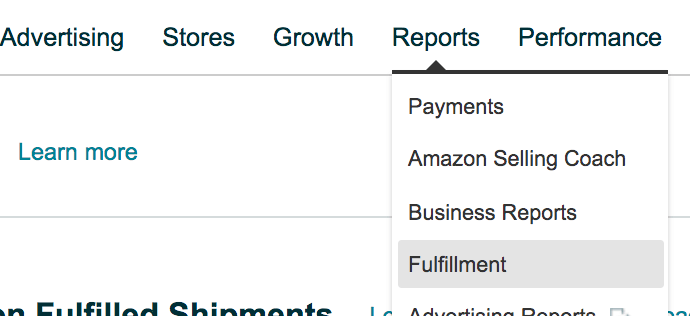
You’ll find every type of Fulfillment report available on your left-hand side on the “Fulfillment” report page
Conclusion
Learn how to use Amazon seller reports, as it is a worthy investment in your business. This information is already available to you and helps keep you out of the dark. You can be foresighted about the health and metrics of your products. Now know your numbers, get creative, and stay ahead of the competition using these reports. Let SIPRANSHECOMMGROWTH helps you with all these Seller Central reports and save you valuable time. Our Amazon ads specialists will thoroughly dig through these numbers while making this data easy for you to understand and help you reach conclusions to drive more sales and grow your business.


